FreeCodeCamp Projects
Here are some of the projects I have completed for freeCodeCamp's Full Stack Javascript Certification, and freeCodeCamp's Data Science with Python Curriculum:
Full Stack Javascript
Front End Libraries
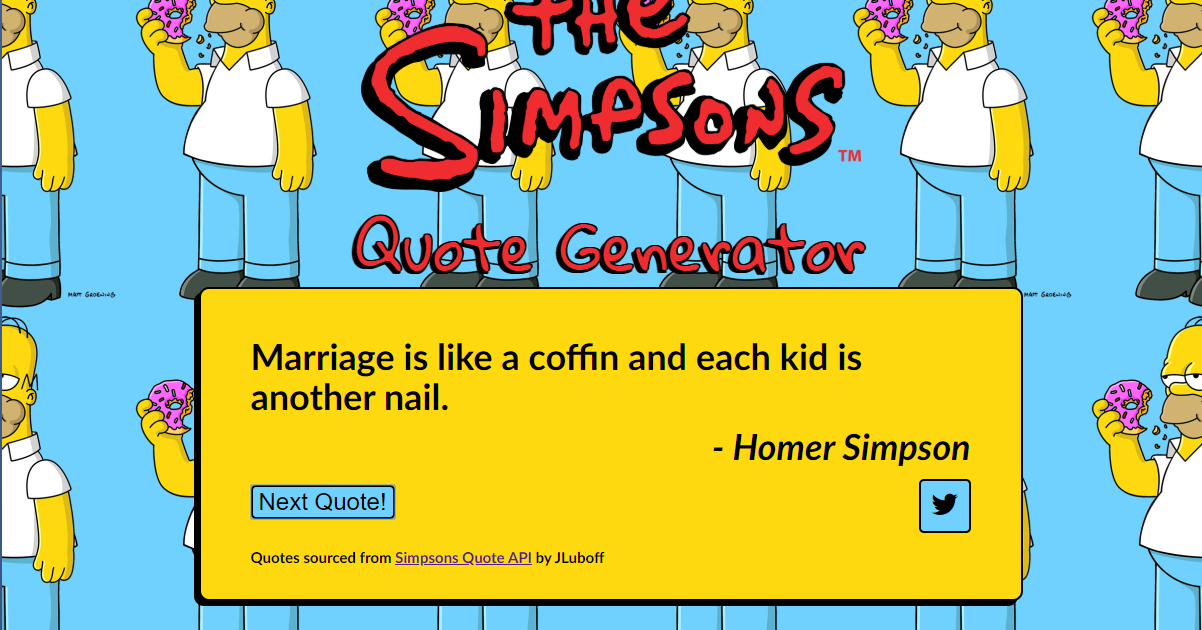
Random Quote Generator
A simple Simpson's-themed random quote generator that accesses random Simpson's quotes using an API and displays them on screen.
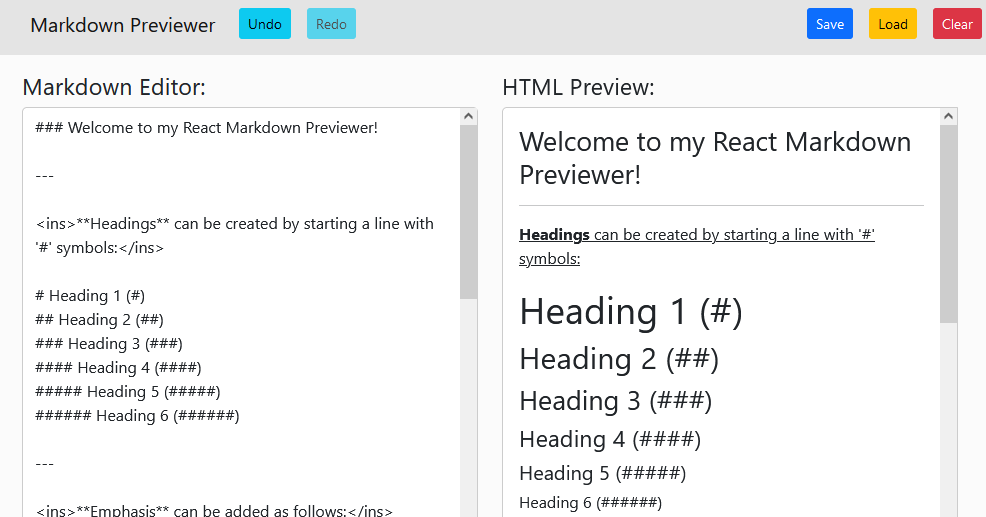
Markdown Previewer
A handy application where users can type GitHub markdown into an editor and see a live preview of the resulting HTML. Built using React.
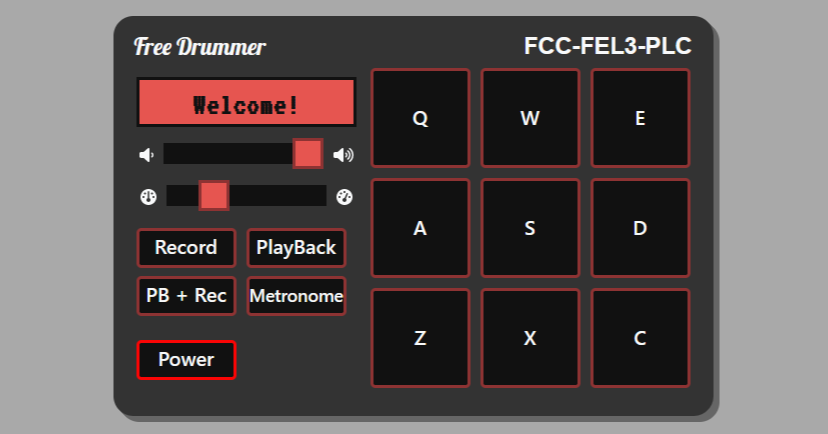
Drum Machine
An interactive Drum Machine where users can play, record and playback a drum track of their own design. Built using React, bundled using webpack.
![]()
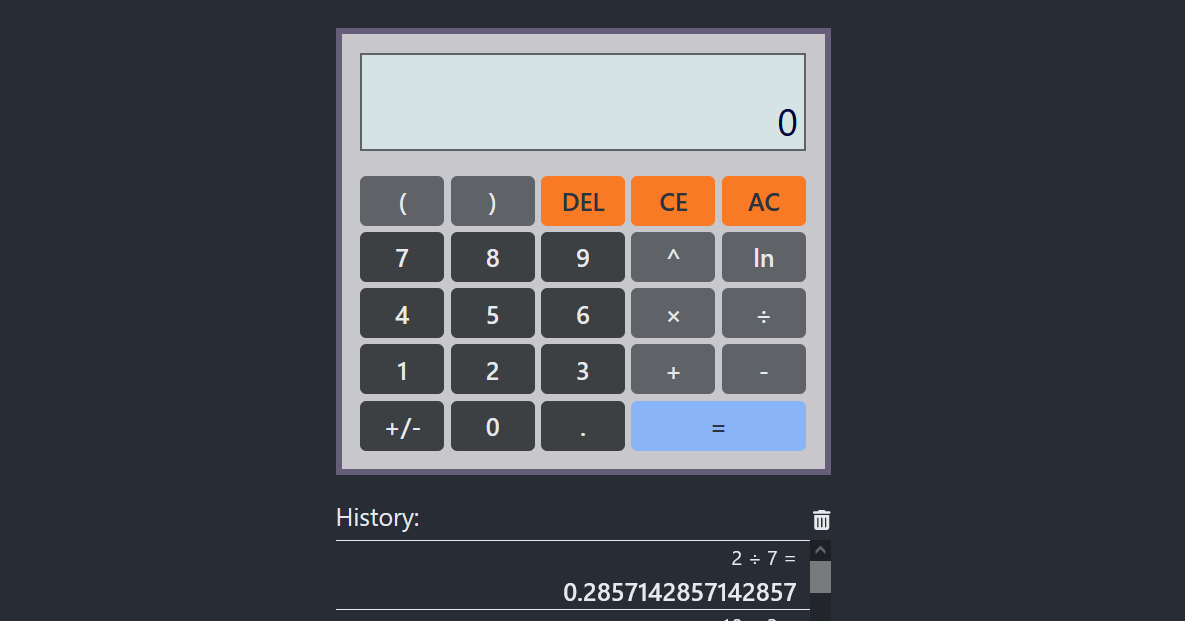
Calculator
A basic calculator app where users can enter calculations and view the results. Built using React with a Create React App template.
![]()
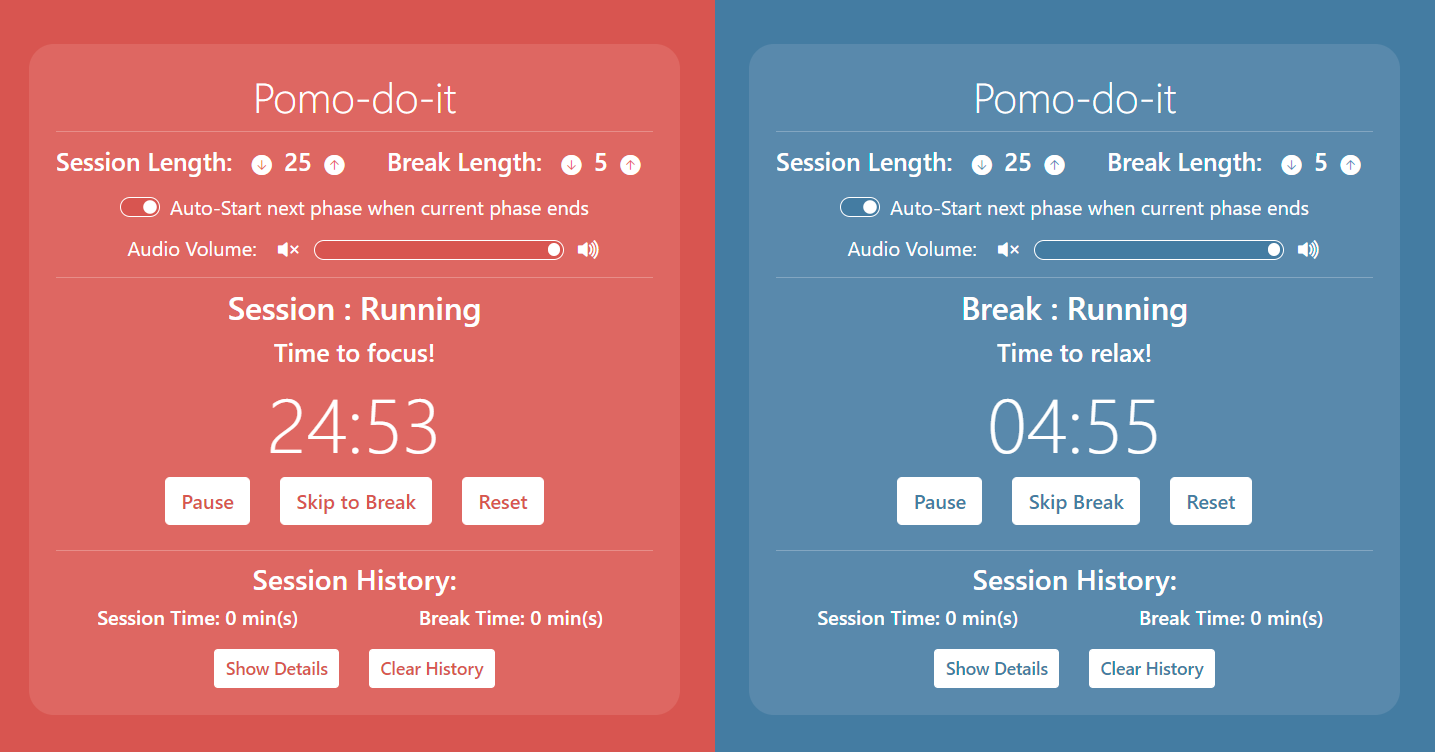
25 + 5 Timer
A Pomodoro Timer app, allowing users to focus on tasks with regular short breaks. Built using React in the Next.js framework.
![]()
Data Visualisation
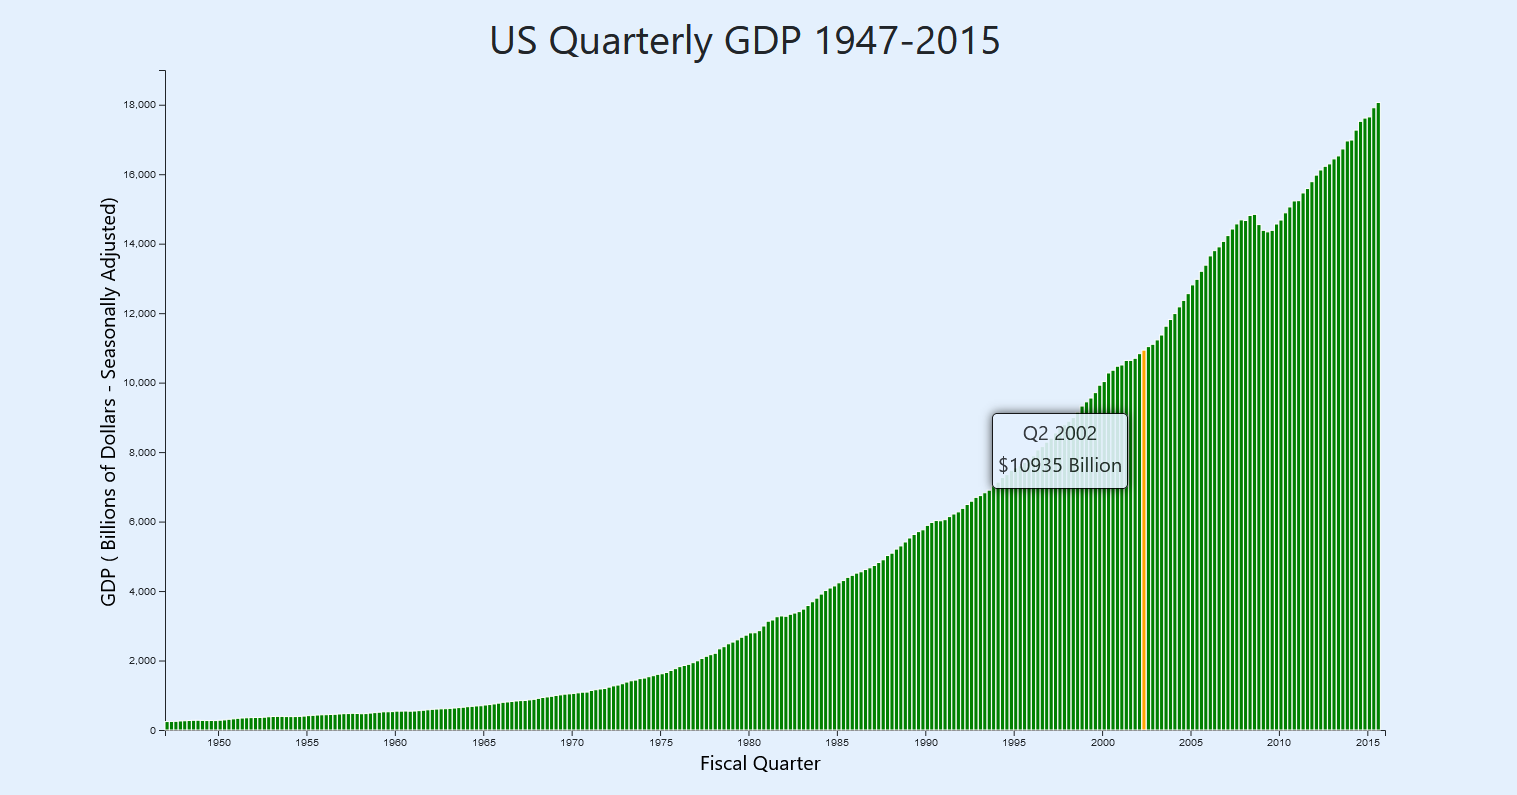
U.S. GDP Bar Chart
A responsive, interactive bar chart of US Quarterly GDP data, built using D3's low-level SVG API.
![]()
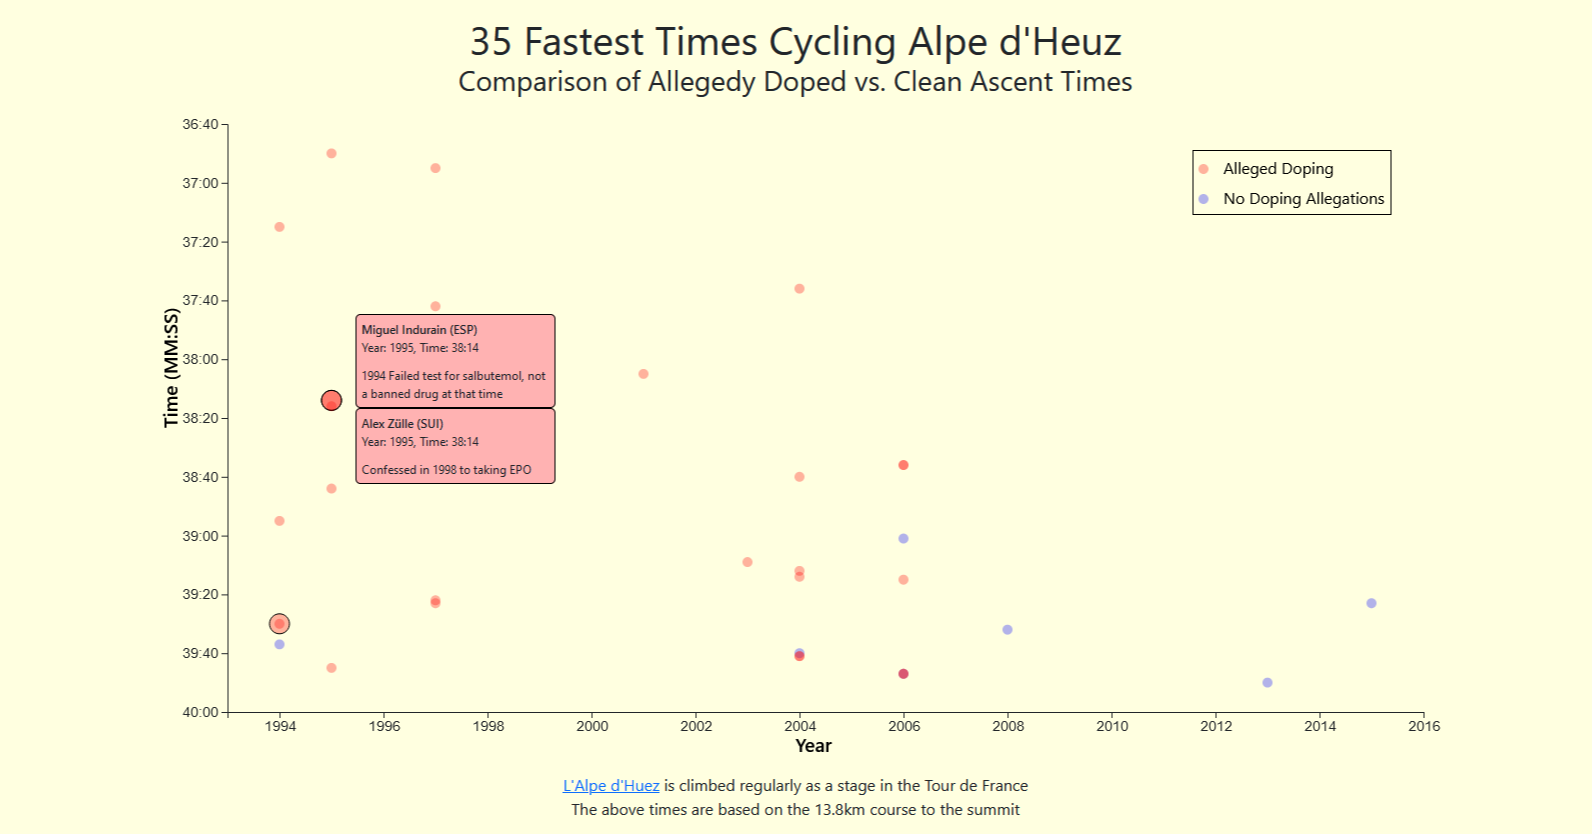
Alpe d'Huez Scatter Plot
An interactive scatter plot of the top 35 cycling ascent times of Alpe d'Huez, separated by whether doping allegations have arisen for each rider. Built using D3, bundled using webpack.
![]()
![]()
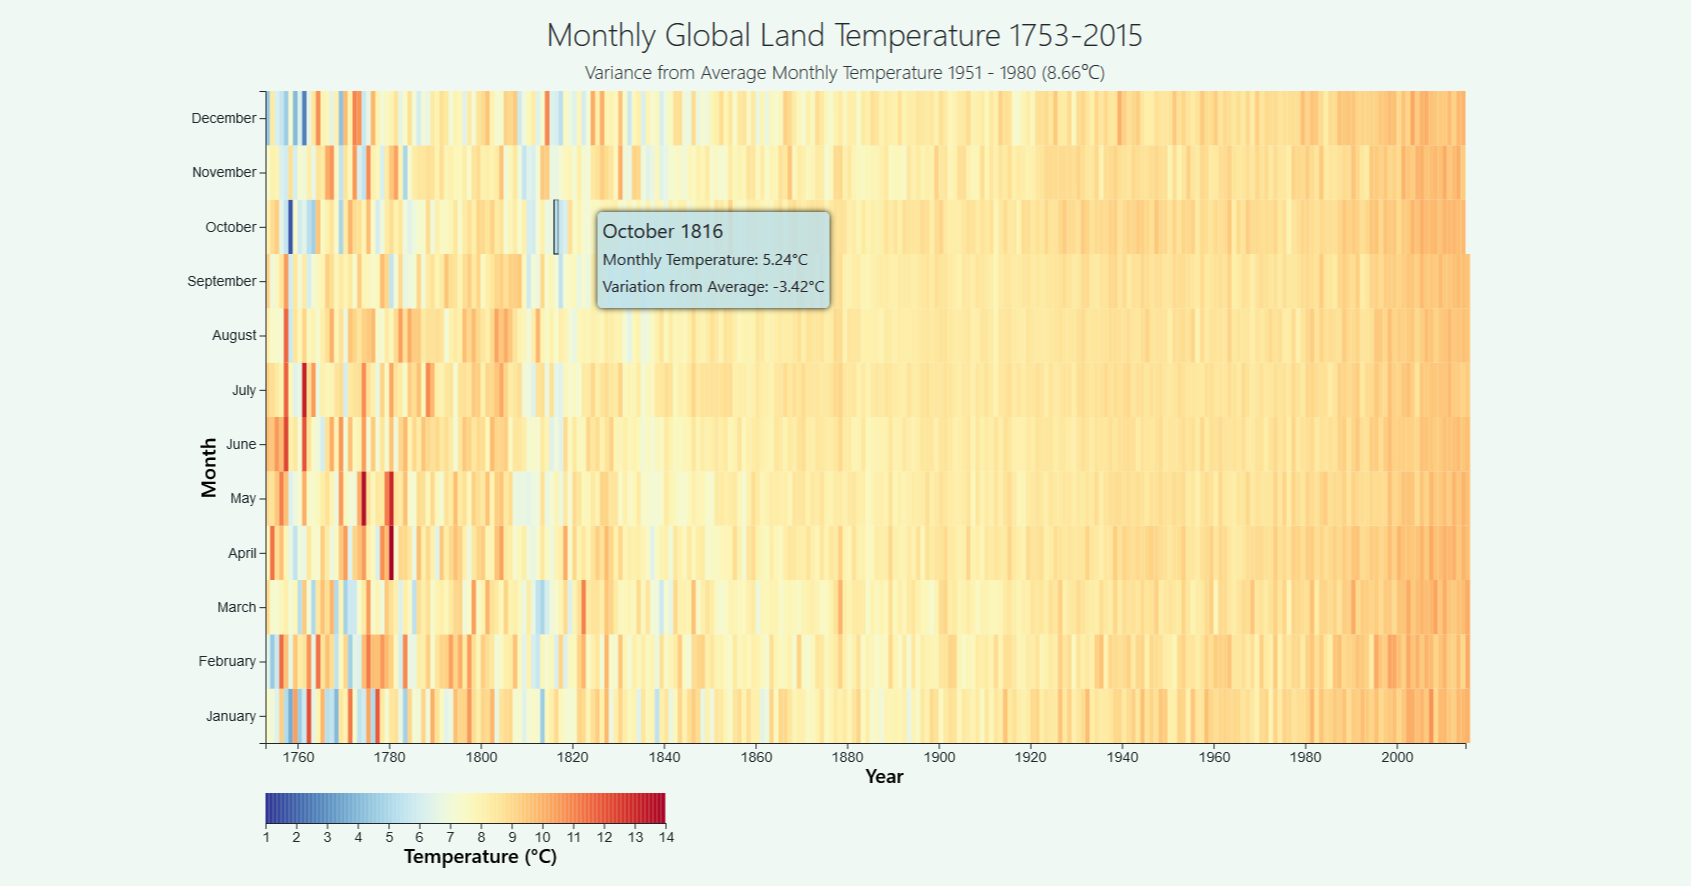
Temperature Heat Map
An interactive heat map of the monthly global land temperature from 1753-2015, relative to the average temperature from 1951-1980. Built using React and D3, bundled using webpack.
![]()
![]()
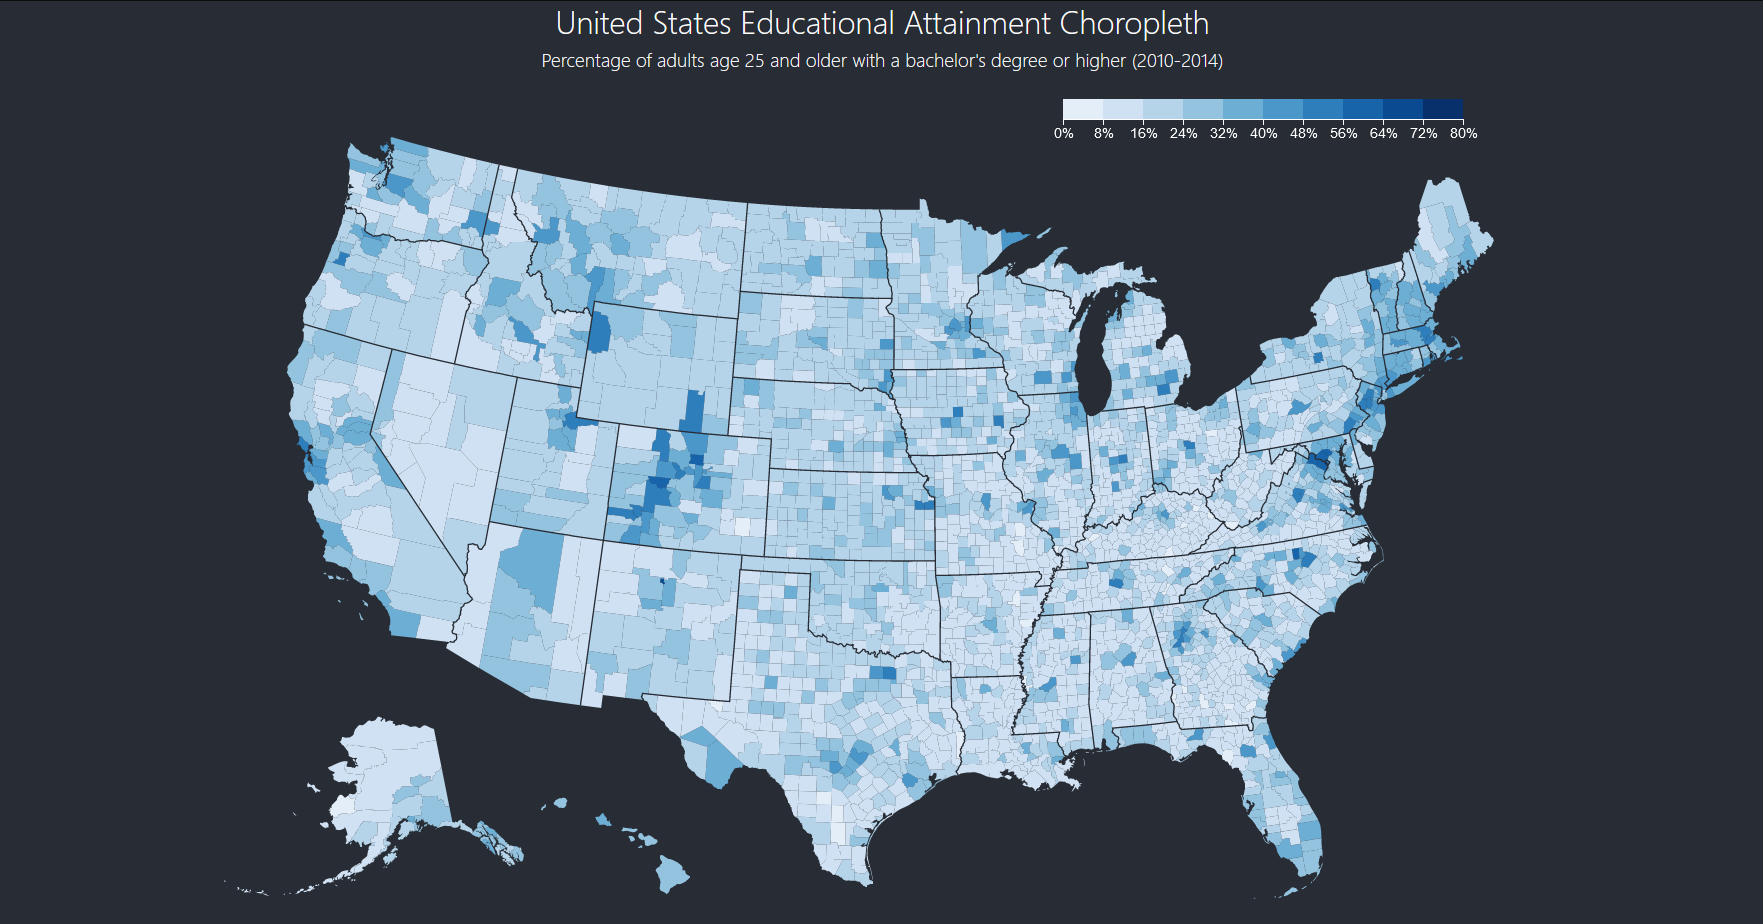
U.S. Education Choropleth
A responsive, interactive choropleth map of educational attainment across all U.S. counties. Built using React and D3, bundled using Create-React-App.
![]()
![]()
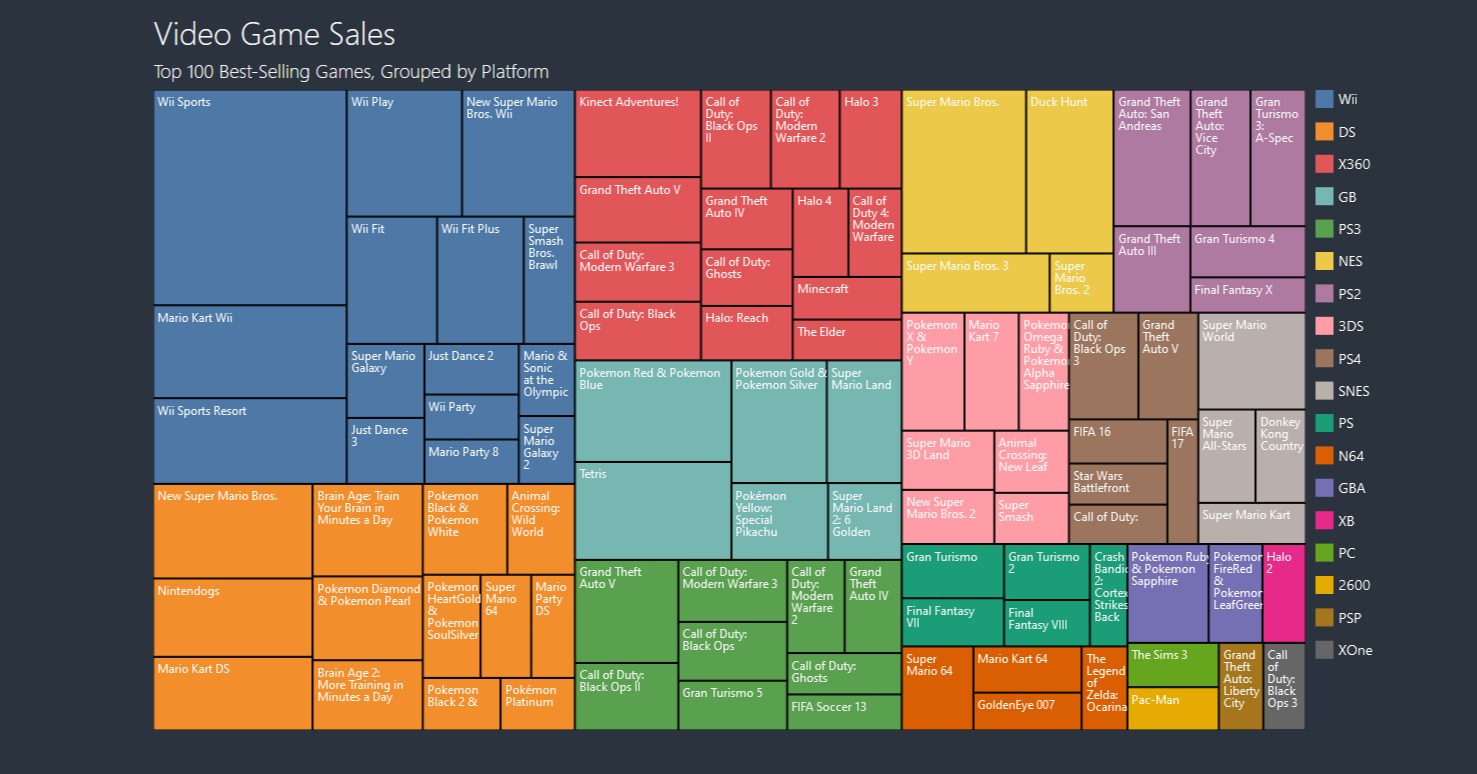
Multi-Dataset Tree Map
An app where a selection of datasets (best-selling games, top box office movies, highest Kickstarter pledges) can be visualised in a Tree Map. Built using React and D3 in the Next.js framework.
![]()
![]()
Back End Development and APIs

Timestamp Microservice
A microservice that can provide timestamps for a given day, unix timestamp, or the current time. Built using the Express web framework.
![]()

Request Header Parser Microservice
A microservice that returns header data (ip address, request language, request software) from requests sent to it. Built using the Express web framework.
![]()

URL Shortener Microservice
A microservice that, given a URL, returns a shortened URL that will redirect to the original. Built using the Express web framework and a MongoDB database with mongoose object modelling.
![]()
![]()
![]()

Exercise Tracker
An API that allows users to create an account ID, add exercise details to their account and view their exercise logs. Built using the Express web framework and a MongoDB database with mongoose object modelling.
![]()
![]()
![]()

File MetaData Microservice
A microservice that returns metadata information for uploaded files. Built using the Express web framework, with Multer middleware to handle multipart form data.
![]()
Quality Assurance Projects
Metric-Imperial Converter
A simple Metric-Imperial converter App and API, allowing users to convert units. Built using the Express web framework, with a Mocha/Chai test suite.
![]()
![]()
![]()

Issue Tracker
A simple Issue Tracking App and API, allowing users to create, read, update and delete issues for projects. Built using the Express web framework, a MongoDB database and with a Mocha/Chai test suite.
![]()
![]()
![]()
![]()

Personal Library
A simple Personal Library App and API, allowing users to add and delete books and add comments to books. Built using the Express web framework, a MongoDB database and with a Mocha/Chai test suite.
![]()
![]()
![]()
![]()

Sudoku Solver
A Sudoku puzzle App and API, allowing users generate random Sudokus, request moves to be checked for validity, and request puzzle solutions. Built using the Express web framework with a Mocha/Chai test suite.
![]()
![]()
![]()

American-British Translator
A simple translation App and API, allowing users to translate text from American English to British English and vice versa. Built using the Express web framework with a Mocha/Chai test suite.
![]()
![]()
![]()
Data Science with Python
Scientific Computing with Python
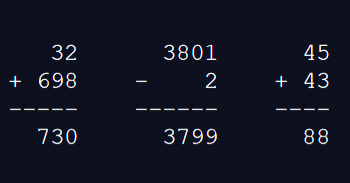
Arithmetic Formatter
A python function that receives a list of arithmetic problems and returns a formatted version of the sum and answer.
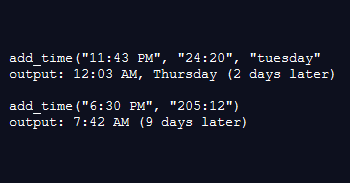
Time Calculator
A python function that can add a duration to a starting time, and return the resulting time, day of the week etc.
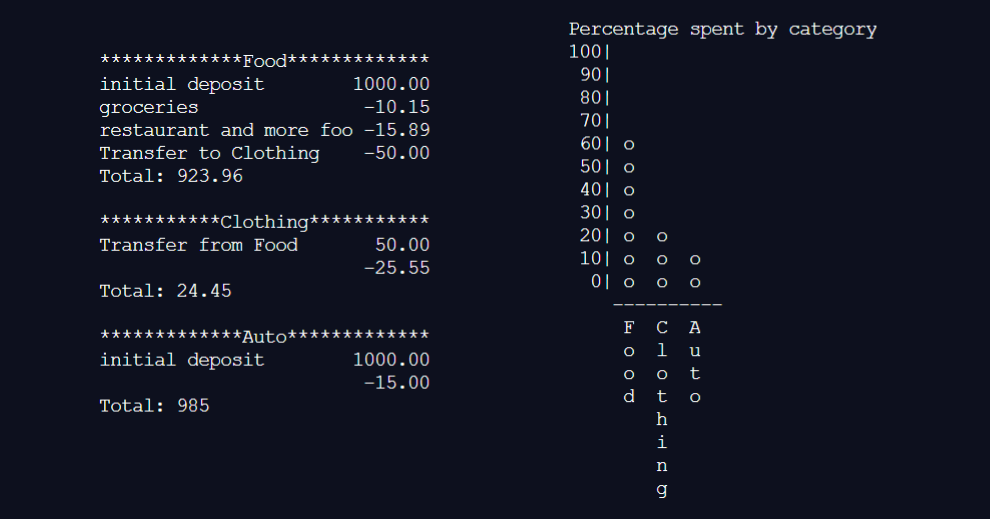
Budget App
A python class for creating budget items, and a spending chart function which plots the percentages spent across budget items.
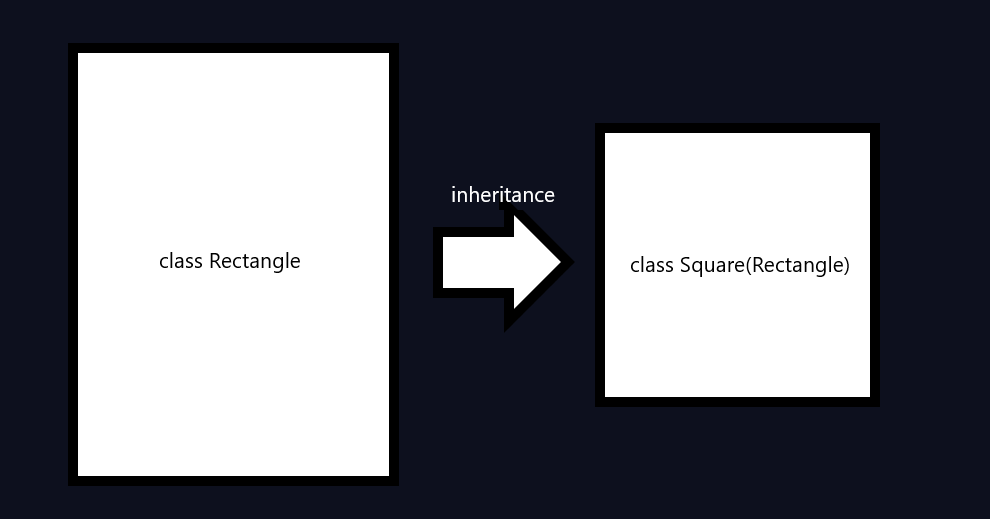
Polygon Area Calculator
Rectangle and Square classes created using Python OOP, with Square class inheriting various methods from the Rectangle parent class.
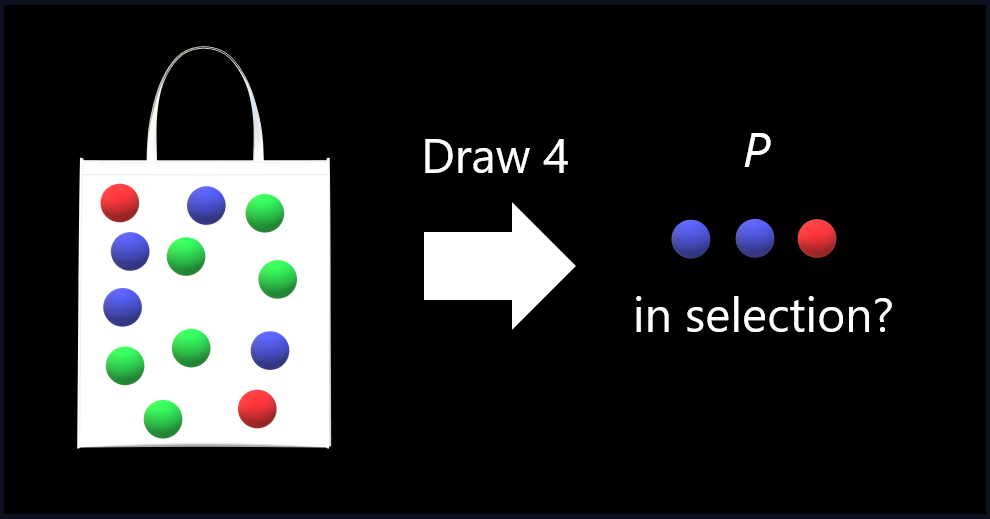
Probability Calculator
A program that carrys out a Monte Carlo simulation of pulling coloured balls from a hat, to estimate the probability of a given result.
Data Analysis with Python
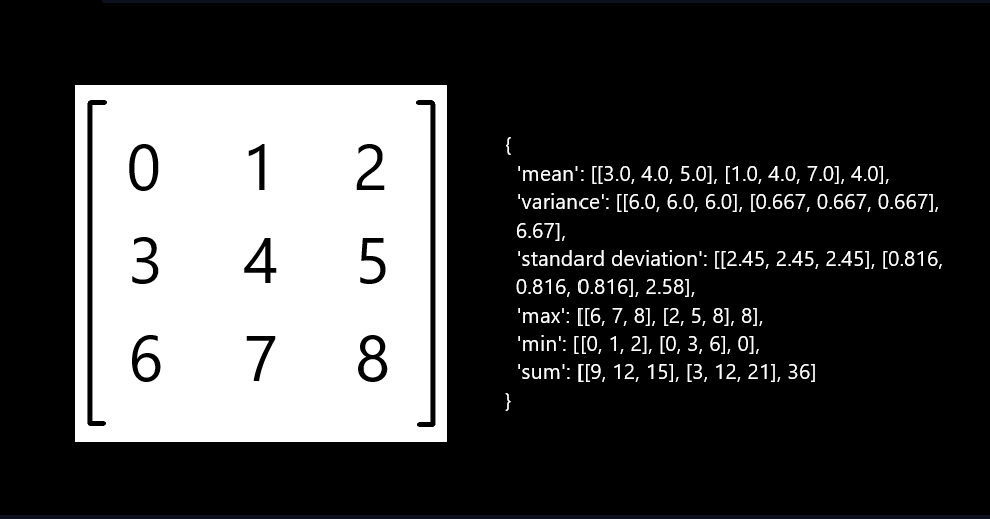
Matrix Stats Calculator
A function that calculates various descriptive statistics for a given 3x3 matrix using Numpy.
![]()
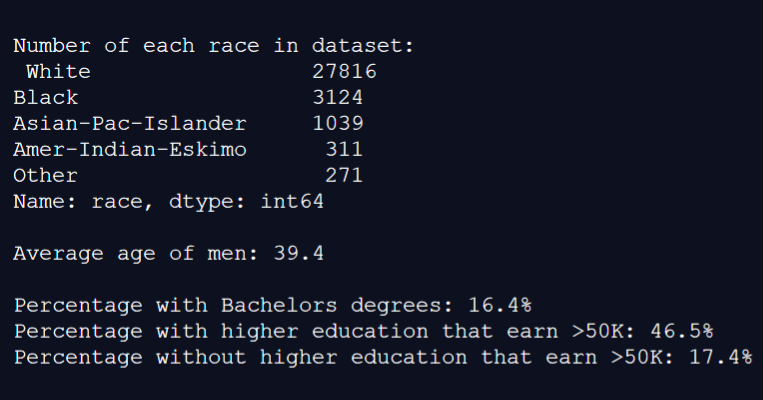
Demographic Data Analyser
An analysis using Pandas of the 1994 "Census Income" dataset from the UCI Machine Learning Repository.
![]()
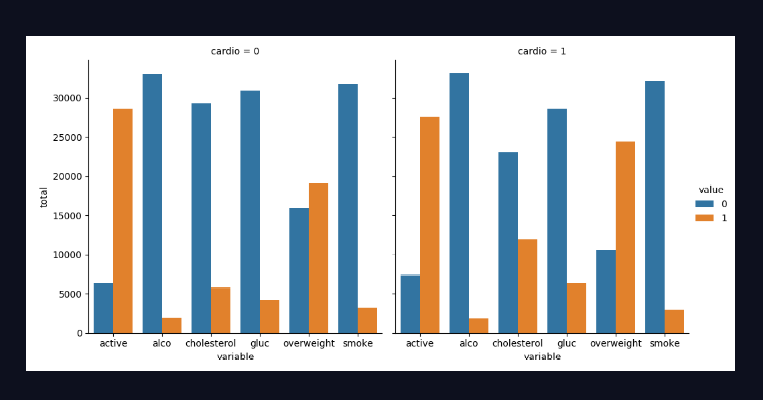
Medical Data Visualiser
A visualisation of a cardiovascular health medical examination dataset, using Pandas, Matplotlib and Seaborn.
![]()
![]()
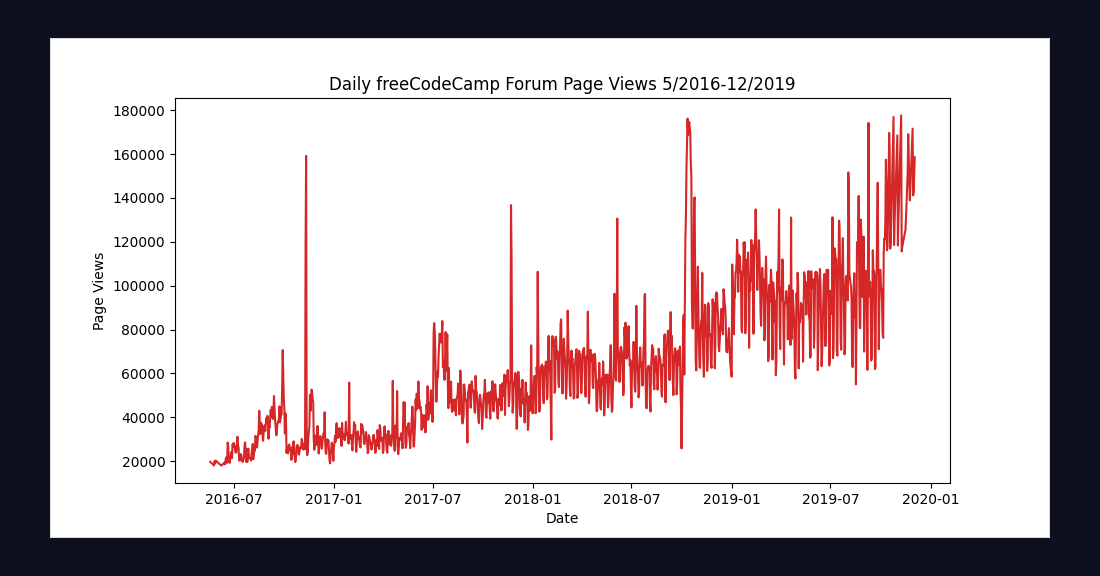
Page View Visualiser
A visualisation of a time series dataset containing the number of page views each day on the freeCodeCamp forum, using Pandas and Matplotlib.
![]()
![]()
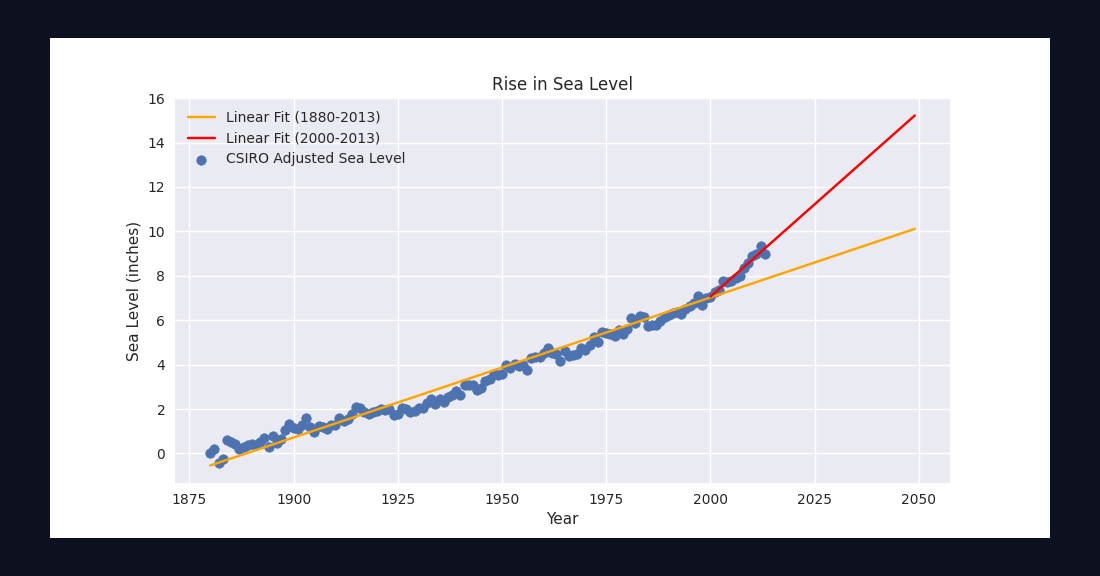
Sea Level Predictor
An analysis of a dataset containing the Global Average Absolute Sea Level Change from 1880-2014. Lines of best fit are found for the dataset using SciPy, to estimate Sea Level in 2050.
![]()
![]()
![]()